How many HMOs are in your neighbourhood? The real toll of shared homes across North Northants
and live on Freeview channel 276
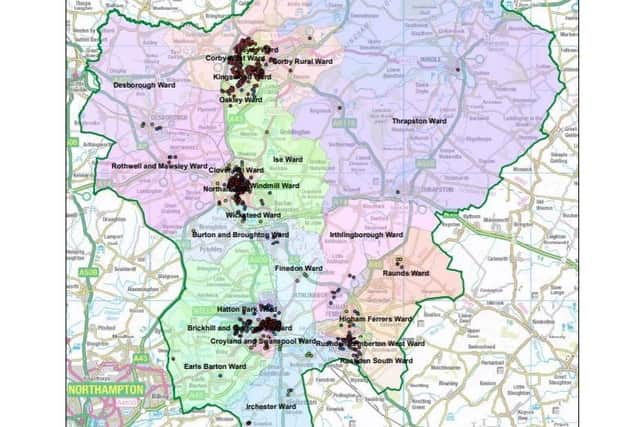
The true number of HMOs in each council ward across the whole of North Northamptonshire can finally be revealed today.
Because only larger houses in multiple occupation have to be officially registered, smaller houses in multiple occupation have often flown under the radar and have never been noted in publicly-available figures, whatever their impact on their neighbours.
Advertisement
Hide AdAdvertisement
Hide AdBut thanks to painstaking work by North Northamptonshire Council (NNC) planning officers who have combed through council tax records as well as licensing, planning and environmental health data, the full picture of the proliferation of HMOs in our area has been laid bare.

They found that there are actually 1,114 HMOs in North Northamptonshire.
Their figures show that the ward area with the most HMOs is Kingswood and Hazel Leys (KW&HL) - with 202 HMOs in the area which represents 2.5 per cent of all homes there. The area, Corby's most deprived, accounts for 18 per cent of all HMOs across the whole of North Northamptonshire. They also found that there were an astonishing 475 complaints from KW&HL residents on issues like waste and noise in the three years up to last September.
In Kettering, the ward with the biggest concentration of HMOs is Clover Hill, which covers an area around Rockingham Road to the north of the town. There are 113 HMOs representing 1.8 per cent of all homes.
Advertisement
Hide AdAdvertisement
Hide AdCroyland and Swanspool ward has the highest number of HMOs in the Wellingborough area: there are 89 HMOs which is 1.05 per cent of all homes there.

There are also a surprisingly high number of HMOs in Finedon ward (which also takes in the area around Wellingborough railway station) with 130 HMOs representing 1.5 per cent of all homes in the ward and 12 per cent of North Northamptonshire's HMOs.
HMOs have provided a solution to a housing need for many low-paid workers in our flourishing logistics and manufacturing industries during recent years. But they have also helped drive-up the prices of family homes and have caused issues with parking, noise, rubbish and anti-social behaviour in some areas.
Last year, the Northants Telegraph began a campaign for an Article Four Direction to be imposed in Corby after residents told us that they were fed up with the impact that a spiraling number of HMOs were having on their neighbourhoods.
Advertisement
Hide AdAdvertisement
Hide AdOur campaign was backed by MP Tom Pursglove and, soon after, NNC launched a review to look at the issue across the whole authority area.
They set up a cross-department working group to look at the issue and are due to present an interim report back to the council's Planning Policy Executive Advisory Panel next Monday (February 21).
As part of their work the working group aimed to come up with a comprehensive tally of registered and unregistered HMOs to help them target action to the areas that most need it.
Their next step is to develop profiles for each ward to look more closely at clusters of HMOs and the issues they bring with them. Their research will also include looking at a wider range of solutions as well as article four directions, which would allow officers to force even the smallest of HMOs to apply for planning permission.
Advertisement
Hide AdAdvertisement
Hide AdIn the report they say their work has 'significantly improved' the understanding of HMOs in North Northamptonshire.
Here are the number of HMOs in each area, plus the number of complaints they generated in three years between 2018 and 2021. Because of differing pre-unitary IT systems, complaints are only available for former Corby and East Northants wards.
You can find our what ward you are in by typing in your postcode here.
Brickhill and Queensway; Total households 6,990; HMOs 42 (0.6% of all homes)
Advertisement
Hide AdAdvertisement
Hide AdBurton and Broughton Ward; Total households 6,701; HMOs 8 (0.12% of all homes)
Clover Hill, Kettering; Total households 6,237; HMOs 113 (1.81% of all homes)
Corby Rural; Total households 9,143; HMOs 9 (0.1% of all homes); Complaints 110
Corby West; Total households 8,109; HMOs 99 (1.22% of all homes); Complaints 198
Advertisement
Hide AdAdvertisement
Hide AdCroyland and Swanspool; Total households 8,467; HMOs 89 (1.05% of all homes)
Desborough; Total households 7,322; HMOs 6 (0.08% of all homes)
Earls Barton; Total households 8,998; HMOs 2 (0.02% of all homes)
Finedon; Total households 8,475; HMOs 130 (1.53% of all homes)
Advertisement
Hide AdAdvertisement
Hide AdHatton Park; Total households 7,607; HMOs 23 (0.30% of all homes)
Higham Ferrers; Total households 7,091; HMOs 17 (0.24% of all homes); Complaints 121
Irchester; Total households 6,732; HMOs 15 (0.22% of all homes);
Irthlingborough; Total households 7,830; HMOs 12 (0.15% of all homes) Complaints 165
Advertisement
Hide AdAdvertisement
Hide AdIse, Kettering; Total households 6,224; HMOs 4 (0.06% of all homes)
Kingswood; Total households 8,197; HMOs 202 (2.46% of all homes); Complaints 475
Lloyds, Corby; Total households 8,425; HMOs 46 (0.55% of all homes); Complaints 218
Northall, Kettering; Total households 9,697; HMOs 128 (1.32% of all homes)
Advertisement
Hide AdAdvertisement
Hide AdOakley, Corby; Total households 6,746; HMOs 31 (0.46% of all homes); Complaints 132
Oundle; Total households 9,050; HMOs 2 (0.02% of all homes); Complaints 58
Raunds; Total households 6,985; HMOs 5 (0.07% of all homes); Complaints139
Rothwell and Mawsley; Total households 6,902; HMOs 5 (0.07% of all homes)
Advertisement
Hide AdAdvertisement
Hide AdRushden Pemberton West; Total households 6,520; HMOs 29 (0.44% of all homes); Complaints 184
Rushden South; Total households 8,427; HMOs 34 (0.4% of all homes); Complaints 212
Thrapston; Total households 9,867; HMOs 2 (0.02% of all homes); Complaints 104
Wicksteed; Total households 7,205; HMOs 39 (0.54% of all homes)
Advertisement
Hide AdAdvertisement
Hide AdWindmill, Kettering; Total households 5,903; HMOs 22 (0.37% of all homes)
A report to councillors by senior planning officer Bernice Taylor states: "The majority of all known HMOs are located within the Kingswood ward in Corby, Finedon ward in Wellingborough, Northall ward and Clover Hill ward in Kettering. Interestingly, the analysis shows the proportion of HMOs as a percentage of the total households is relatively low, with the highest in Kingswood at 2.46 per cent.
"Comparable evidence for Northampton shows significantly higher ranges between 8 per cent and 14 per cent.
"Where information is available, the evidence shows higher levels of complaints in the urban areas. However, establishing a correlation between the level of complaints and extent of HMOs is difficult due to widespread information gaps related to complaints data.
Advertisement
Hide AdAdvertisement
Hide Ad"Article 4 directions should be limited to situations where it is necessary to protect local amenity or the well-being of the area and must be based on robust evidence and apply to the smallest geographical area possible."
Officers will now scrutinise six wards in more detail. They will be Clover Hill, Corby West, Croyland and Swanspool, Finedon ward, Kingswood & Hazel Leys and Northall ward in Kettering to consider a wide range of measures to help them manage the concentration of HMOs there.
Gez Scott lives on the Hazel Leys estate close to three separate HMOs. He said: "I'm glad they're looking at doing something. I hope they do it quickly though because this is long overdue.
"The parking is just absolutely unreal and we've had issues with barbecues late at night all year round."