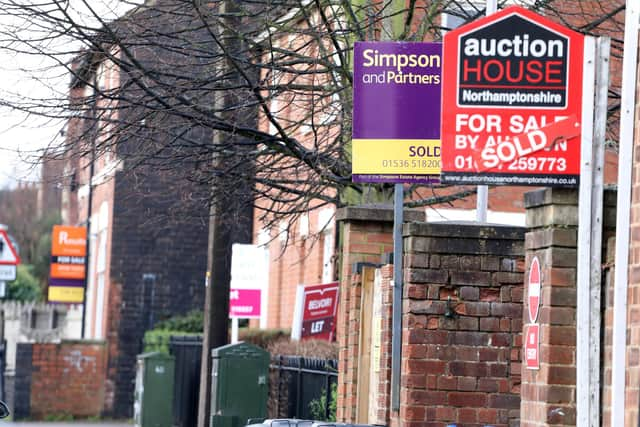
Are house prices falling in North Northamptonshire? Check the local property market with our interactive tool
and live on Freeview channel 276
While house prices are slowing, fewer viewings are taking place and mortgage approvals are at their lowest level outside of the pandemic since 2009 nationally, how is the housing market faring in North Northants?
Official house price data for December has failed to alleviate concerns about the market slowdown, with prices now falling month-on-month across the UK - although they are still rising on an annual basis.
Advertisement
Hide AdAdvertisement
Hide AdIt follows a disastrous mini-budget under the short-lived premiership of Liz Truss who, alongside her chancellor Kwasi Kwarteng, sent mortgage interest rates spiralling after the prospect of massive tax cuts spooked financial markets.
But what do the official figures say about property prices in North Northamptonshire - are they rising or is our area one of the dozens across the UK where prices started to tumble last month?
We have all the answers for you here, alongside an interactive chart that will let you explore what the statistics are telling us about the local property market.
Are house prices rising or falling in North Northamptonshire?
The Office for National Statistics (ONS) and HM Land Registry published the latest official house price data on Wednesday (February 15), known as the UK House Price Index.
Advertisement
Hide AdAdvertisement
Hide AdThis showed average house prices in North Northamptonshire stood at £283,086 in December – 0.4 per cent higher than in November, when prices were at £282,001 and 14.2 per cent higher than in December last year, when the average was £247,940.
The UK House Price Index is based on property sales rather than asking prices or mortgage data, and is therefore considered the most reliable barometer of UK house sale activity.
Across the UK, house prices have risen by 9.8 per cent in the past year, from £268,115 to £294,329.
While prices may be much higher than last year, the rate of inflation has slowed – prices were up 10.6 per cent in the year to November, and 12 per cent in the year to October.
Advertisement
Hide AdAdvertisement
Hide AdThe ONS said some of the recent annual inflation rates have been volatile due to fluctuations in prices during 2021.
For instance, there was a sharp fall in average prices in October 2021 following the end of the Stamp Duty holiday, which made year-on-year growth in October 2022 particularly high.
Alongside an average cost, the House Price Index data also offers a more detailed view of the housing market, with average prices published for detached, semi-detached, and terraced homes, flats and prices faced by first-time buyers.
Advertisement
Hide AdAdvertisement
Hide AdThe biggest year-on-year growth came in West Lancashire where prices were up by 23.8 per cent, followed by Blaenau Gwent in Wales, on 23.3 per cent.
Prices were down in just seven councils, all but one of which (Aberdeen, where prices were down 4.9 per cent year-on-year) were in London.
On a monthly basis however, more than 170 local authority areas saw house prices fall.
Across the UK as a whole, semi-detached properties saw the strongest growth, with prices up by 11.2 per cent year-on-year.
Prices for flats meanwhile were up by only 6.4 per cent.
Advertisement
Hide AdAdvertisement
Hide AdIn North Northamptonshire, property prices for various types of home were as follows:
- Detached homes: average price of £450,366, up 13.6 per cent since last December
- Semi-detached homes: average price of £269,800, up 14.9 per cent since last December
- Terraced homes: average price of £217,504, up 14.7 per cent since last December
Advertisement
Hide AdAdvertisement
Hide Ad- Flats: average price of £132,845, up 11.7 per cent since last December
You can look up more information about property prices in North Northamptonshire and elsewhere over time in the charts on the NationalWorld.com website.
This includes an interactive graph showing house prices over the past 20 years in every local area.
What will happen to the housing market in 2023?
The Bank of England is warning that the supply of homes for sale is increasing faster than demand, and that higher borrowing costs and concerns about affordability are ‘weighing significantly’ on first-time buyers.
Advertisement
Hide AdAdvertisement
Hide AdAs a result, the majority of offers put in by potential buyers are now below the asking price, and the number of house viewings taking place has fallen sharply, according to insight from the Bank’s contacts in the housing market.
HM Land Registry says the housing market will ‘remain on a downward trajectory over the coming months’, with monthly data from the Bank of England showing fewer mortgages were approved in December – the fourth consecutive monthly decrease.
If the Covid pandemic period is excluded, the number of new mortgages approved are at their lowest level since January 2000, it said.