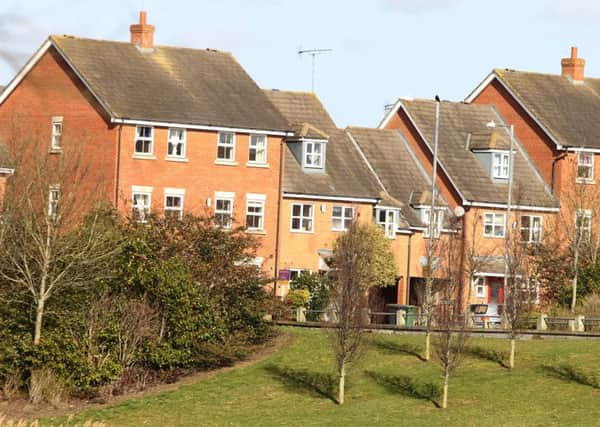
Corby house prices rise by more than 500 per cent in 30 years


The figures were revealed in a Halifax report into house price growth in Britain’s new and expanded towns over the past three decades.
Milton Keynes, which is celebrating its 50th birthday, was identified as the best-performing new town for property price growth.
Advertisement
Hide AdAdvertisement
Hide AdCorby came third on the list, with the average price of a house there now £173,633 – a rise of 561 per cent since 1986.
New towns generally have seen house prices increase by nearly a third (32 per cent) over the past 10 years, increasing by just over £55,500, from £173,337 in 2006 to £228,902 in 2016.
House prices across Britain generally have increased by just over a quarter (26 per cent) over the past 10 years, from £200,059 to £251,679 - an increase of about £51,600.
Halifax said that since 1986, property prices in Milton Keynes have surged by 601 per cent to reach £309,415 on average.
Advertisement
Hide AdAdvertisement
Hide AdTelford, Warrington and Skelmersdale were the new towns with the next strongest percentage increases in house price growth between 1986 and 2016.
Many of the new towns with the strongest house price growth over the past 10 years are in the London commuter belt, with prices in Welwyn Garden City, Stevenage and Hemel Hempstead seeing particularly strong gains since 1986, the report said.
Northampton also featured highly on the list, coming in at number six.
New towns were created in waves after the Second World War, generally emerging between the 1940s and 1960s and helping to alleviate housing shortages following the war.
Advertisement
Hide AdAdvertisement
Hide AdHalifax, which used its own database, examined the house price performance of 26 new and expanded towns to mark the milestone birthday of Milton Keynes.
Martin Ellis, a housing economist at Halifax, said: “Milton Keynes has been the best-performing of all the new towns created following the Second World War in terms of house price performance since 1986.
“Many of these new towns are within easy commuting distance of major commercial centres, where property is typically more expensive, particularly in the South East, where the average property price is well
below that in London.
“This makes them a highly popular choice with home buyers, explaining their relatively good house price performance, and this popularity has been particularly notable during the last decade.”
Advertisement
Hide AdAdvertisement
Hide AdHere is how average house prices across Britain’s new towns have increased between 1986 and 2016, according to Halifax, with the average house price in 2016 followed by the percentage increase:
Milton Keynes, £309,415, 601 per cent
Telford, £178,568, 586 per cent
Corby, £173,633, 561 per cent
Warrington, £198,106, 559 per cent
Skelmersdale, £138,466, 551 per cent
Northampton, £228,014, 544 per cent
Redditch, 210,149, 521 per cent
Welwyn Garden City, £362,656, 508 per cent
Bracknell, £365,874, 498 per cent
Peterborough, £200,589, 477 per cent
Hemel Hempstead, £350,183, 472 per cent
Stevenage, £297,238, 468 per cent
Peterlee, £126,066, 464 per cent
Basildon, £256,060, 462 per cent
Harlow, £280,592, 461 per cent
Hatfield, £370,960, 445 per cent
Washington, £148,635, 438 per cent
Livingston, £161,184, 423 per cent
Newton Aycliffe, £157,625, 418 per cent
Crawley, £296,542, 410 per cent
East Kilbride, £150,785, 406 per cent
Cumbernauld, £127,764, 404 per cent
Runcorn, £121,795, 391 per cent
Cwmbran, £159,294, 388 per cent
Glenrothes, £114,583, 351 per cent
Irvine, £122,469, 339 per cent
An earlier version of this story had an incorrect headline, stating prices had risen by more than 500 per cent in 10 years.