Northamptonshire neighbourhoods where Covid case rates are going UP


Nearly one month in, is the latest Covid-19 lockdown working in Northamptonshire?
Boris Johnson issued his latest 'Stay At Home' order on January 4 since when fewer positive coronavirus tests and 86,000 vaccinations delivered have given plenty of cause for hope.
Advertisement
Hide AdAdvertisement
Hide AdBut Government figures show the picture is not rosy everywhere as nearly a fifth of Northamptonshire neighbours saw a RISE in case rates in the most recent set of figures.
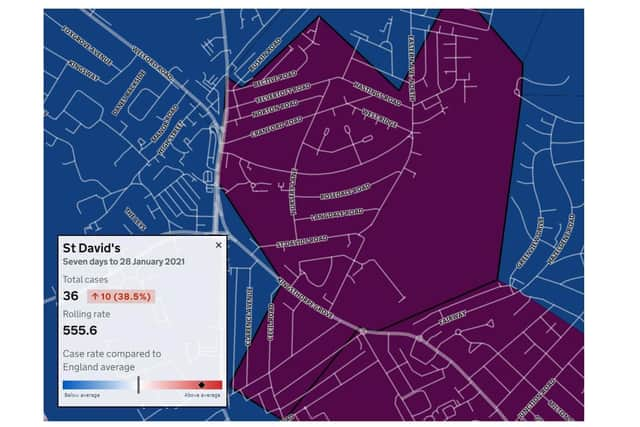
■ Four of the areas are in Northampton and Corby, with increases of nearly 40 per cent in weekly case rates.
■Two in Wellingborough, one in Kettering and two in Towcester have seen rises of up to 31 per cent.
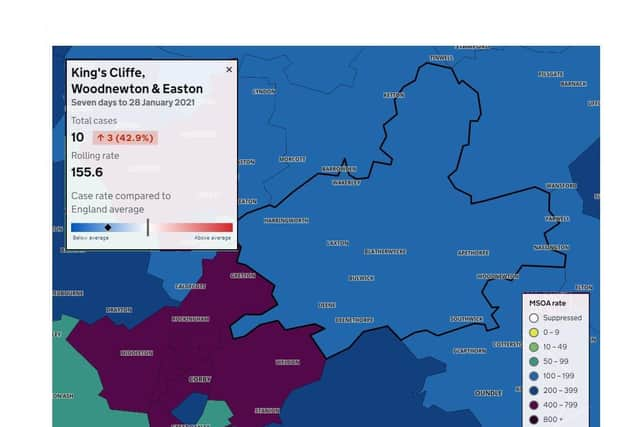
■ And a host of East Northamptonshire villages including King's Cliffe, Woodnewton, Stanwick, Ringstead have seen rises of up to 43 per cent.
Advertisement
Hide AdAdvertisement
Hide AdPositive tests in Northamptonshire have halved from more than 5,000 a week in early-January and case rates in 16 areas dropped by 50 per cent or more in the week up to January 28.
County Council cabinet member Ian Morris warned last week: "This is not the time for celebrating a victory over this disease in the county or indeed the country.
"We need to carry on doing what we're doing for some considerable time, I suspect, in order to see things turn around."
Health experts collate data from testing across England and use it to compare infection rates in different areas. Counties, districts and boroughs are divided up into localities with roughly the same number of people — between 7,000 and 8,000 — called Middle Layer Super Output Areas.
Advertisement
Hide AdAdvertisement
Hide AdSeven–day rates are expressed per 100,000 population calculated by dividing the weekly count by each area's population and multiplying by 100,000.
An interactive map shows current rates in every neighbourhood accessible by entering a postcode.