

Northamptonshire has now been in a lockdown for over three weeks — but is it working?
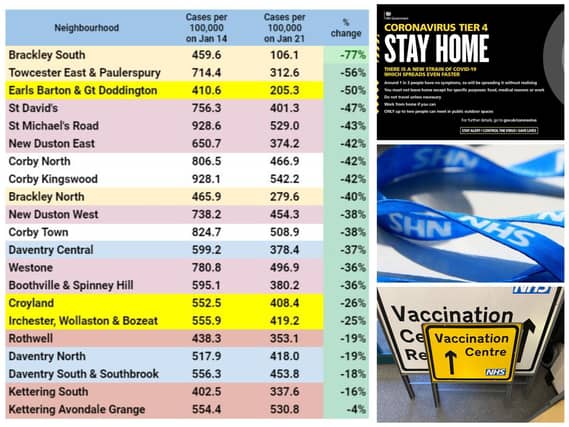
Since mid-January the rate of positive Covid cases per 100,000 people in the county's seven boroughs and districts has been generally falling, according to Government figures.
The latest data shows 62 out of 91 areas have seen a drop in the number of positive tests.
Here we reveal which neighbourhoods in and around Northamptonshire's main towns which have seen the biggest drop in case rates per between January 14 and January 21.
Health experts collate data from testing across England and use it to compare infection rates in different areas. Counties, districts and boroughs are divided up into localities with roughly the same number of people — between 7,000 and 8,000 — called Middle Layer Super Output Areas.
Seven–day rates are expressed per 100,000 population calculated by dividing the weekly count by each area's population and multiplying by 100,000.
An interactive map shows current rates in every neighbourhood accessible by entering a postcode.
1.
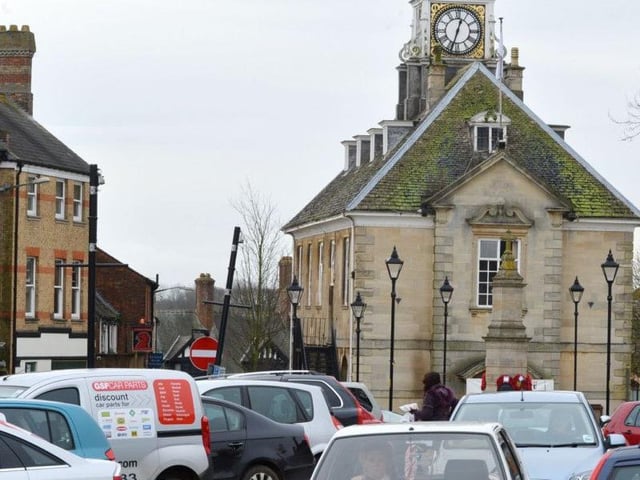
Brackley South has seen rates of positive Covid cases fall by 77% from 459.6 on January 14 to 106.1 seven days later — and Brackley North a fall of 40% from 465.9 to 279.6
2.
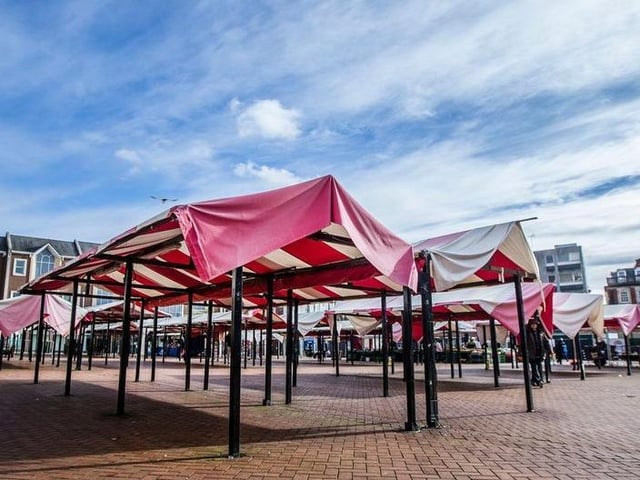
St David's saw the biggest fall in Northampton with Covid cases down by 47% from 756.3 on January 14 to 401.3 on January 23
3.
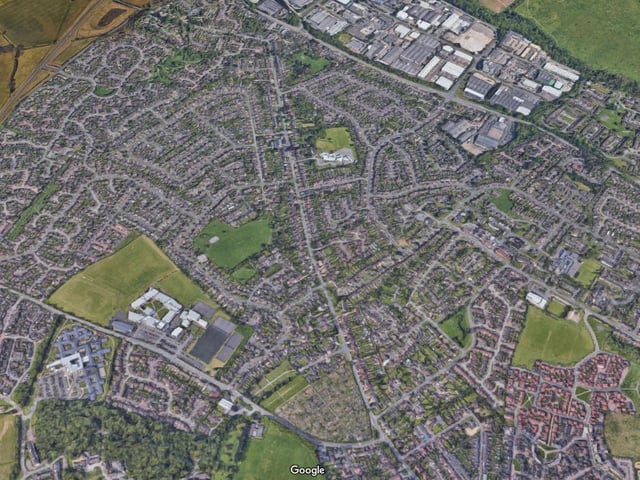
New Duston East saw rates of positive Covid cases fall by 42% from 650.7 to 374.2 while New Duston West's rate dropped 38% from 738.2 to 454.3 according to Government figures.
![Corby North, Corby Kingswood and Corby Town all saw cases fall by more than a third ] has seen with the biggest drop in Corby North, 42% from 806.5 to 466.9 between January 14 and January 21](https://www.derbyshiretimes.co.uk/webimg/T0FLMTI4NTU3MDY3.jpg?crop=4:3&trim=&width=640)
4.
Corby North, Corby Kingswood and Corby Town all saw cases fall by more than a third ] has seen with the biggest drop in Corby North, 42% from 806.5 to 466.9 between January 14 and January 21