
A Level results day 2025: How did this year's cohort do overall - and how did the regions fare?

The big day is finally here for sixth form students and their families 🌅
- Today is A Level results day, with more than 340,000 students receiving their results across the country
- Overall, the proportion of entries earning top A* or A grades is up this year
- About 97.5% of all papers sat earned a passing grade
- However, there were some noticeable differences in students achieving top grades between regions
- STEM subjects have held onto their popularity in 2025 - with some continuing to grow in uptake
At long last, the wait for students to find out how they did in their exams, and which important A Levels qualifications they have managed to earn, is over.
Thursday (August 14) is A Level results day, and some 341,577 students across England, Wales and Northern Ireland will be able to pick up their results envelope from their school or college this morning. Alongside them will be thousands of others picking up vocational qualification and T Level results, the UK’s Joint Council for Qualifications (JCQ) says.
This will be an exciting time for many young people and their families, as the outcomes of any conditional university offers are finalised, and their paths for life after secondary school become a little more clear. The grades themselves will be good news for many too, with the amount of top grades students have achieved rising this year - even as some familiar disparities linger on.
Here are some key figures on how they did this year, from top grades, to most popular subjects, to how each of the regions has fared overall:


A Level results for 2025 at a glance
The number of students taking their A Levels this year remained pretty steady at about 341,577, down just 133 from 2024 – although it is worth noting that the UK’s overall population of 18-year-olds rose 2.6% on last year.
A total of 83,334 A* grades have been awarded across the UK, JCQ reports, up a modest 0.1 percentage point on last year. But when put together with A grades, the proportion of entries earning top grades has climbed 0.5 percentage points on 2024 – while the amount getting any passing grade from A* to E is up 0.3 percentage points.
This means that there were a total of 860,106 passing grades out of 882,509 entries total, or about 97.5% of all of them. A* grades, the very highest available, made up about 9.4%.
Nationwide, students sat about 2.6 A Levels on average – or between two and three. Within England, Ofqual says about 66.3% of learners took three (or two out of three candidates), while about 17.7% took two. Just 195 students total took more than 5 A Levels, and about one in 10 took just the one.
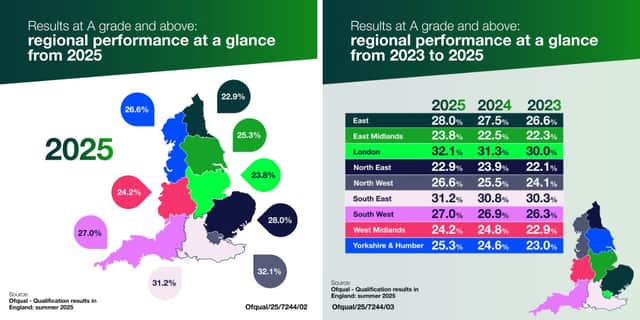
How did each of the regions do?
Data from Ofqual, England’s qualifications regulator, shows that there were once again noticeable regional differences in the percentage of A Level entries receiving top grades. London was once again the highest achieving region, with 32.1% of all entries earning an A or A* grade.
It was followed by the South East at 31.2%; the East of England at 28%; the South West at 27%; the North West at 26.6%; Yorkshire and the Humber at 25.3%; the West Midlands at 24.3%; the East Midlands at 23.8%; and the North East at just 22.9%. England’s national average was 28.2% of entries getting top grades.
While the proportion of top grades in London has risen this year – up 0.8 percentage points – it has actually fallen in the North East, down 1 whole percentage point on 2024’s figures. The other regions which saw their A and A* proportions improve on last year were the East of England, the East Midlands, the North West, the South East, the South West, and Yorkshire. The West Midlands was the only other area to see a decrease.
Some fluctuation year-on-year is normal and to be expected, both in and outside of regions. But a similar pattern could be observed with the proportion of A Level entries earning a C and above.
In order, London and the South East both had 79.5% of entries pass with at least a C, while the North West had 78.2%; the East had 77.8%; the South West had 77.3%; Yorkshire and the Humber had 76.8%; the North East had 74.9%; the West Midlands had 74.2%; and the East Midlands had 73.6%. England’s national average was 77.7%.
In Northern Ireland, the Council for the Curriculum, Examinations and Assessment (CCEA) says that some that 30.4% of students received an A grade or above, a small 0.1 percentage point increase on last year. But the proportion of students getting the very highest grade - an A* - has seen a considerably larger leap, making up 8.7% of total entries, compared to 8.2% in 2024. The country’s overall pass rate (any grade from A* to E) was a whopping 98.7% this year.
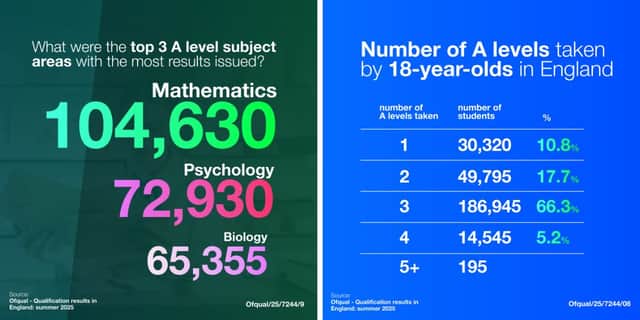
The most popular subjects in 2025
This year’s results reflected a strong interest in STEM subjects, JCQ said, a continuation of a pattern observed over the last previous years. More than 110,000 students took A Level Mathematics – the most popular subject this year and last – while just under 20,000 took further mathematics, and over 15,000 took core maths, a course aimed at students who want to strengthen their maths skills without taking the A Level.
The number of students taking economics, physics and chemistry all grew, it noted, with economics in particular seeing entries rise by 5.5% – and physics moving from the ninth most popular subject last year to sixth this year. Other subjects dropped in popularity, including history (down 5.5%), biology (down 4%), and psychology (down 3.3%). Entries for art and design subjects and sociology also fell slightly.
Here were the top 10 subjects overall this year, as well as how many learners took them:
- Mathematics (taken by 112,138 students)
- Psychology (taken by 75,943 students)
- Biology (taken by 71,400 students)
- Chemistry (taken by 63,538 students)
- Business studies (taken by 45,235 students)
- Physics (taken by 44,957 students)
- History (taken by 44,717 students)
- Sociology (taken by 43,875 students)
- Art & design (taken by 43,124 students)
- Economics (taken by 42,667 students)
Have you or your child received A Level results today, but are unsure what to do next? Here’s our guide on appealing a grade, and here’s our guide to navigating Clearing.