
Wellingborough property market update – February 2026


As January came to a close, the Wellingborough property market continued to show differences between prices, stock levels and transaction activity. Measures did not all move in the same direction, with variations remaining between headline asking prices, achieved outcomes and levels of activity across both sales and lettings.
This article outlines how the local market stood at the end of January, how figures compared with recent months and the same point last year, and how current conditions sit within a longer-term historical and national setting.
Sales market in Wellingborough
Prices and asking levels
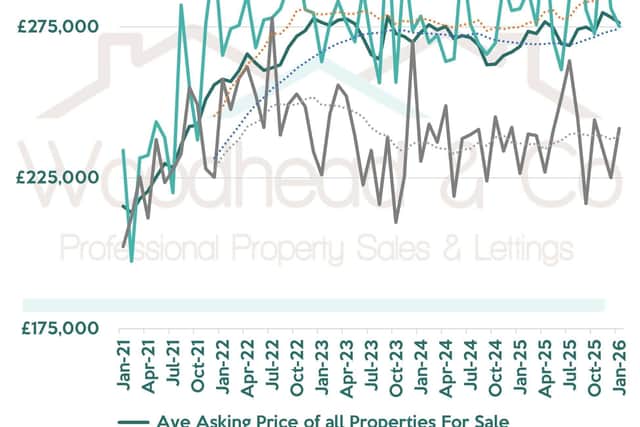
By the end of January, average asking prices across all properties for sale in Wellingborough remained close to recent levels. Month-on-month changes were modest, while comparisons with the same point last year showed prices remaining above January 2025 levels.
Asking prices on newly listed properties showed greater variation than the overall market average. Changes in the mix of homes coming to market meant that pricing on new listings moved differently from the broader average, illustrating that short-term movements in new listing prices do not always align with wider market averages.
Average asking prices on sold properties continued to sit below headline asking prices across the market. This maintained the gap between advertised prices and the levels at which properties ultimately transacted, particularly when compared with figures recorded in early 2024.
Stock levels, sales volumes and time to sell
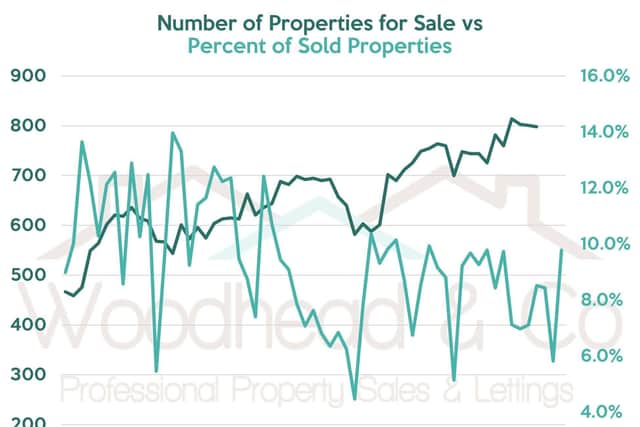
The number of properties available for sale in Wellingborough shifted again during January. Stock levels remained lower than those recorded toward the end of 2025, reflecting continued restraint in available supply compared with earlier periods.
New listings followed a similar pattern, with fewer properties coming to market than during busier months seen previously.
Completed sales during January remained lower than some of the higher-activity months of 2025. However, when compared with the same month last year, sales volumes held up more closely on an annual basis than month-to-month figures alone indicate.
Average time to sell remained within a relatively narrow range. Selling times stayed close to recent rolling averages, suggesting that while activity levels varied, the pace at which homes moved from listing to sale did not change sharply during the month.
Taken together, January reflected moderate sales activity alongside restrained stock levels, with selling times broadly consistent with recent months.
Lettings market in Wellingborough
Rents and pricing
In the lettings market, average asking rents in Wellingborough remained broadly steady during January. Month-on-month movement in advertised rents was limited, indicating relative stability in headline rental pricing at the start of the year.
Average achieved rents also showed little short-term movement, continuing the pattern seen toward the end of 2025. The difference between asking and achieved rents remained narrow, indicating consistency between advertised and agreed rental levels.
On a year-on-year basis, rental prices remained higher. Both asking and achieved rents were above January 2025 levels, showing that while short-term change was limited, rental pricing remained elevated compared with the same period last year.
Rental stock, let-agreed volumes and time to let
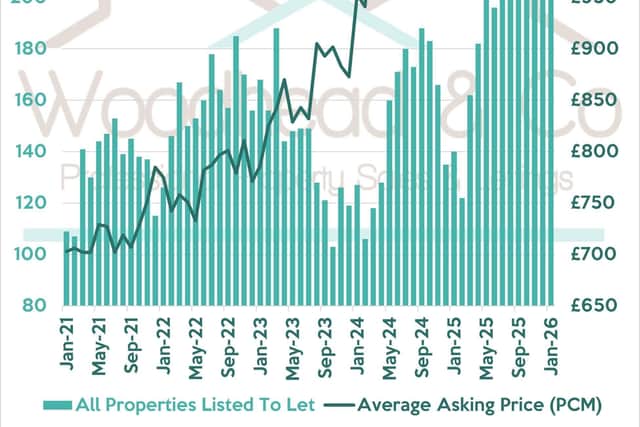
Rental stock levels remained constrained during January. The number of properties available to let stayed below levels seen earlier in 2025, continuing the pattern of tighter supply at the start of the year.
Let-agreed volumes held relatively steady. While monthly totals did not return to the highest levels seen during busier periods, activity compared more favourably with the same month last year.
Average time to let remained higher than early-2024 levels. Letting times stayed above longer-term lows, reflecting a slower pace of agreement compared with last year, while remaining within the range observed over the past six months.
Longer-term market context
Looking beyond individual monthly movements, rolling measures place current conditions within the wider range observed since 2021.
In the sales market, average asking prices remained closer to the upper end of the historical range, while sold prices continued to sit below earlier peak levels. Current prices remained well above the troughs recorded in early 2021, despite staying below the highs seen during periods of elevated market activity.
Stock levels and completed sales volumes also sat within the middle of their historical ranges rather than at extreme highs or lows.
In the lettings market, rental prices remained elevated relative to early-2021 levels. Stock levels and letting times reflected a market that has adjusted from the faster pace seen during earlier periods of exceptionally high demand.
Price sensitivity and historical scenarios
Historical price equivalence comparisons provide context for how current prices relate to past periods. These comparisons are historical only and do not represent forecasts.
At current levels, average asking prices across all properties most closely align with price points last seen during periods in 2023. A 5% reduction from current average asking prices would broadly correspond with levels observed during parts of 2022, while a 10% reduction would align more closely with prices last seen during late-2021.
For sold properties, current average asking prices sit closer to values recorded during 2021–2022. A 5% reduction from current sold-price levels would align with pricing seen earlier in 2021, while a 10% reduction would correspond with levels near the lower end of the post-pandemic recovery period.
These scenarios are included solely to illustrate where similar price points have appeared historically and should not be interpreted as indicators of future price movement.
National market commentary (context only)
National and regional housing market commentary published by major UK property organisations references expectations of low single-digit price movement during 2026 rather than sharp national changes.
Individual organisations, including Zoopla, Rightmove, Nationwide, Halifax, Savills, JLL and RICS, publish outlooks independently using different datasets and assumptions. As a result, figures and views published by each organisation vary and are subject to revision.
Across published material, house price commentary commonly references outcomes within a broad range of approximately 0% to +4%. Rental market commentary frequently references continued rental growth, often cited within a range of around +2% to +4% at a national level.
These figures represent published opinions at the time of writing. They are not forecasts for Wellingborough and are included solely to outline the wider national environment within which local market activity is taking place.
Data sources
Local sales and lettings data referenced is sourced from Zoopla Pro.
National housing market commentary referenced is drawn from publicly available material published by organisations including Zoopla, Rightmove, Nationwide, Halifax, Savills, JLL, RICS, the Office for Budget Responsibility and HM Treasury.
All information is correct at the time of publication.